Service discovery and monitoring


Service discovery and monitoring |
|
|
How services are detected and monitored nVision monitors UDP/TCP services based on a predefined set of rules. It not only checks if the specific port is open, but sends a request and waits for a response. Then, the response is examined to meet specific criteria. Only those services where a response is valid are considered as properly functioning services. The same mechanism is used to discover services running on hosts. It ensures that services are not mistakenly discovered when any service is running on the port supposed to be for another one. For example if FTP would be running on port 80, nVision will not discover service HTTP, as the response is not valid as an HTTP response. Service down After a service stops responding, then it gets the status <Down>. You can see that as a red colorized icon in the service grid (available on the Services tab in the Host Info window). Leading service There is always one leading service for each host. This service is indicated by bold font in the service grid located in the Host info window. The leading service is the most important service of the host. Its response time can be presented on the host icon. How to monitor hosts and services? After discovering hosts in your network, nVision automatically scans for the most important services running on them. So, there is no need to take any further actions in addition to discovering the network to begin monitoring of hosts and their services. However, you can add a new service manually or by calling the service discovery tool.
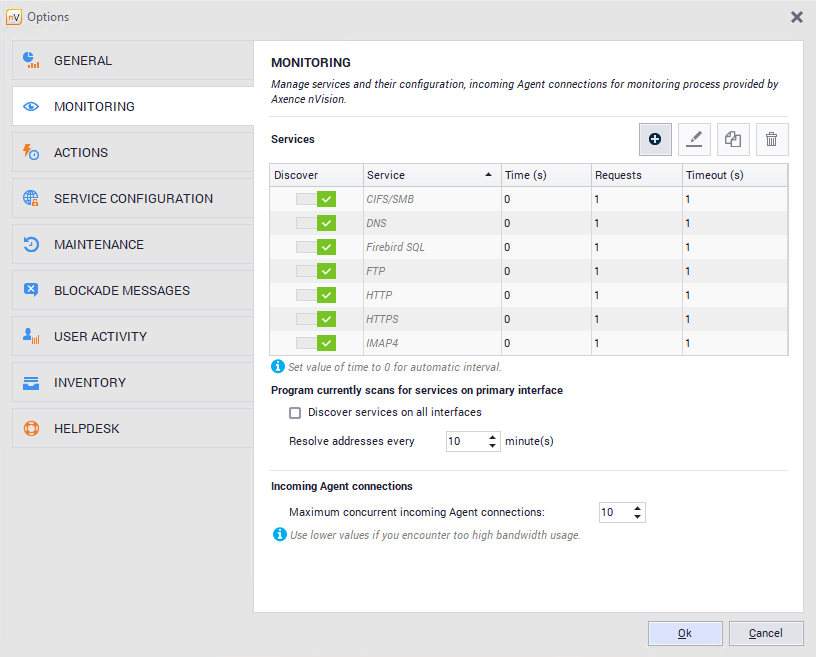
Adding services To add a new service to the default list of monitored services: 1.Go to nVision settings located on main toolbar. Navigate to the 2.If you want to add a service, click the add button and select the service that is to be monitored from the list. To manage the service definitions, click the Manage services button. Services on hosts A list of monitored services including charts that represent the response time and percent of packets/requests lost is available in the Host status window. For more information about services refer to Managing hosts topic. |