Network module widgets


Network module widgets |
|
|
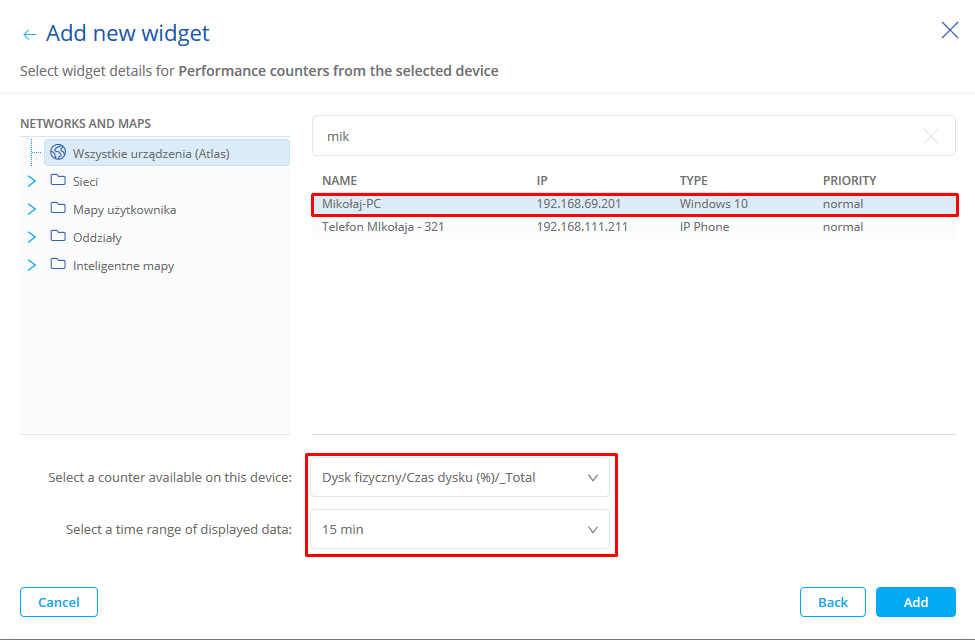
Performance counter for a selected device The widget makes it possible to view a graph showing the values of a specific performance counter for the selected device. The configuration requires the selection of the device, the performance counter, and time range for the data to be shown:
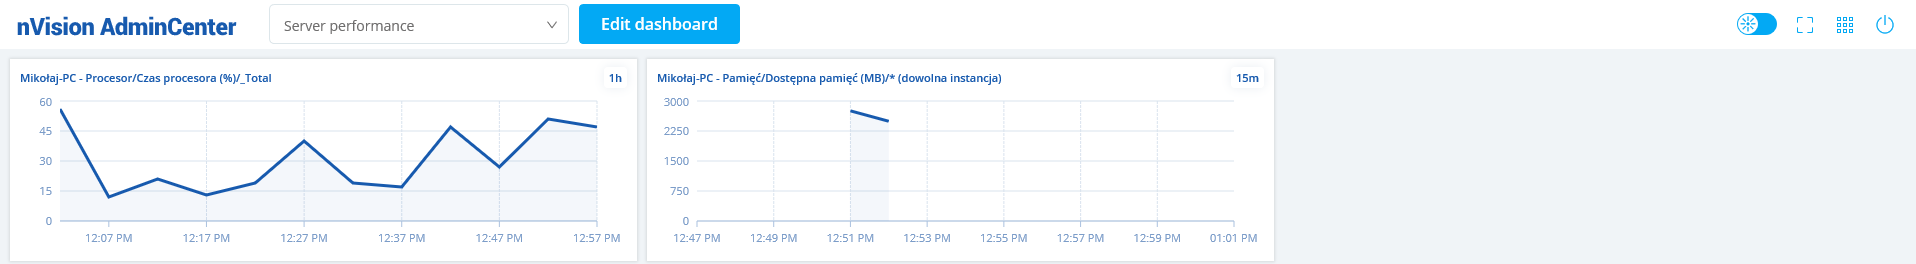
The screenshot below shows an example of the widget:
Note! To add a widget with a performance counter, the performance counter must be added to the device beforehand.
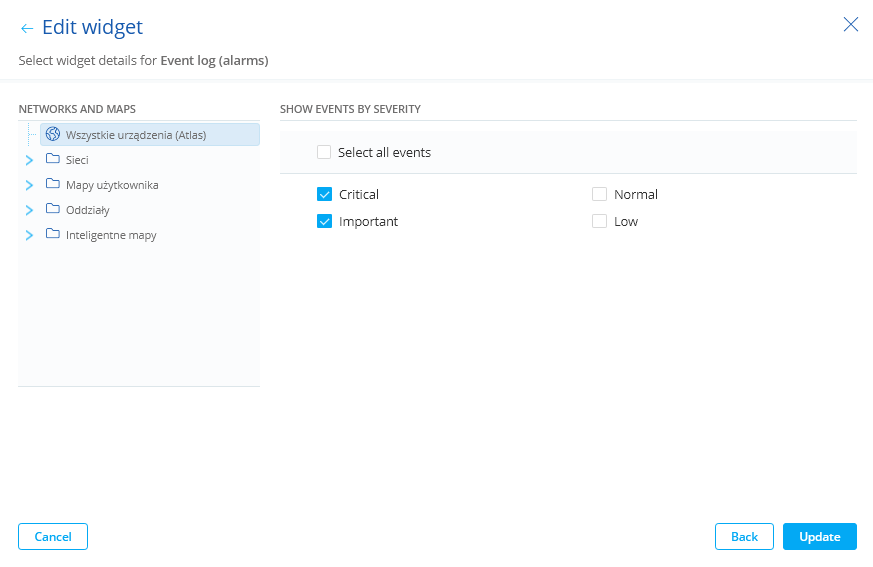
Event log (alerts) The widget makes it possible to view a table with the event log, which is also visible in the nVision con-sole. The administrator can narrow down the displayed results depending on the importance of the event:
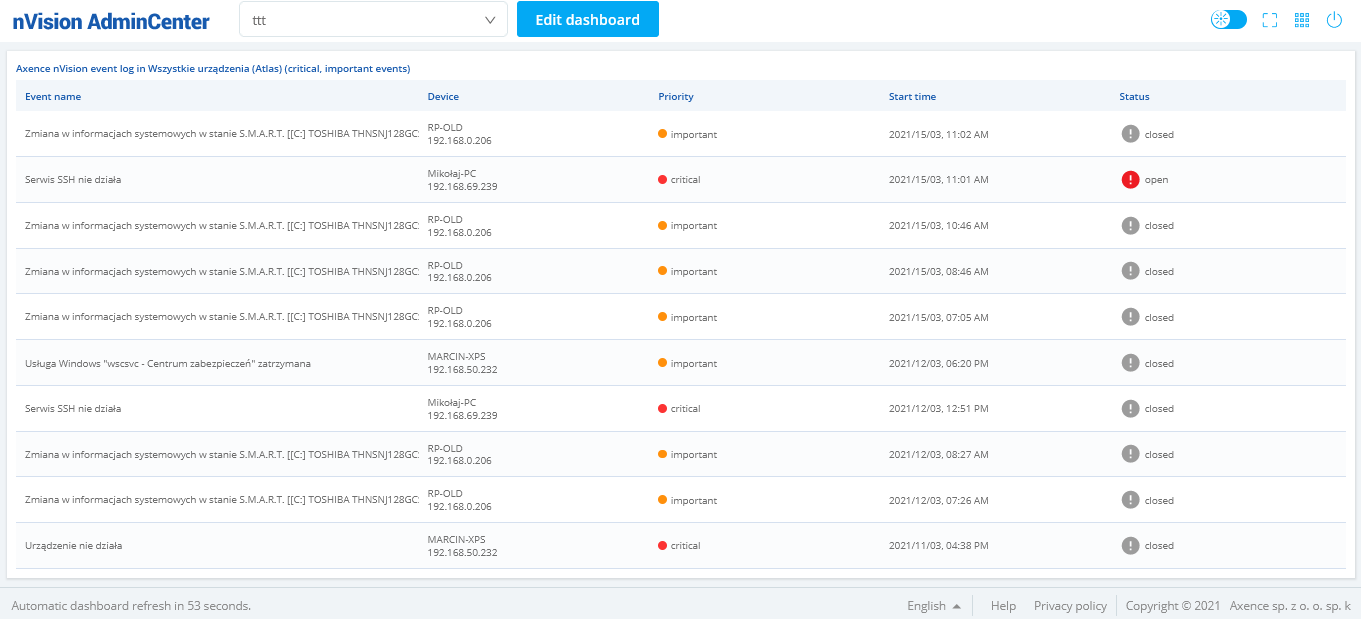
The screenshot below shows an example of the widget:
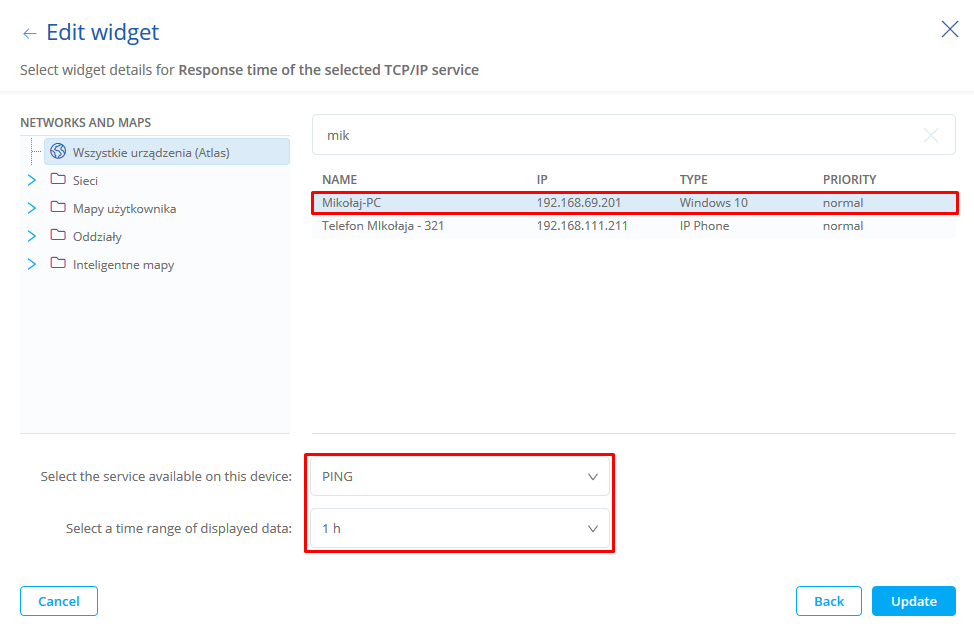
Response time of selected TCP/IP service The widget makes it possible to view a graph showing the values of responses from the selected TCP/IP service for the selected device. The configuration requires the selection of the device, the TCP/IP service and time range for the data to be shown:
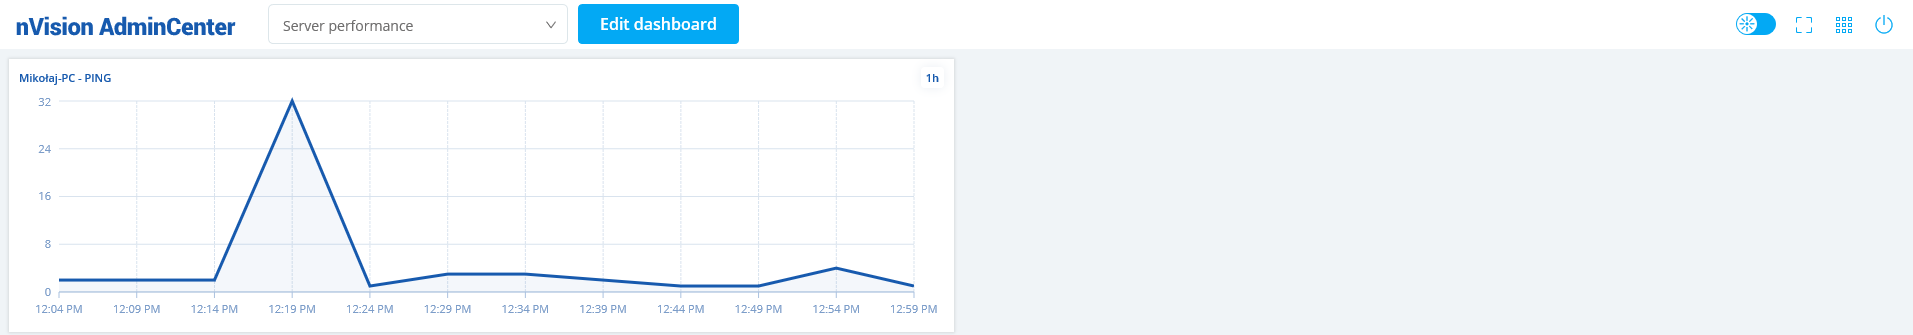
The screenshot below shows an example of the widget:
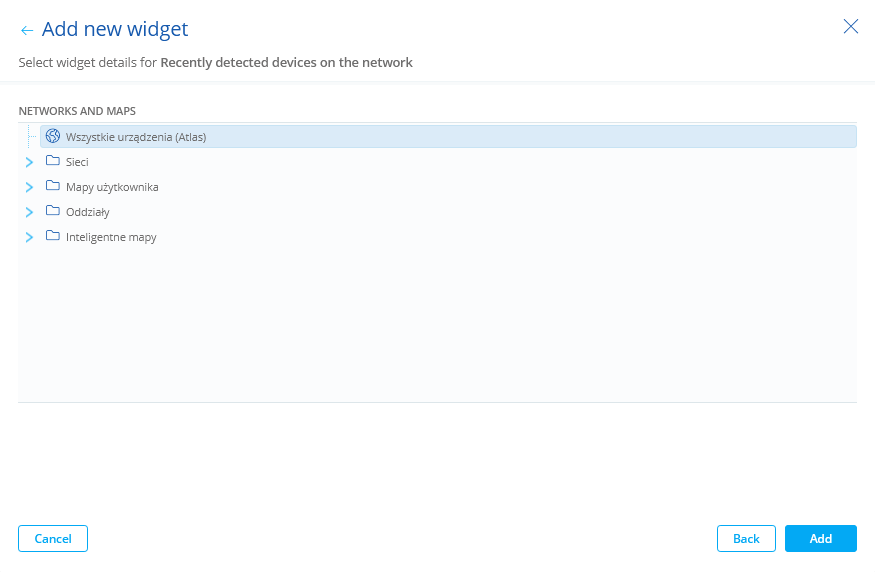
Note! To add a widget with a response time of the TCP/IP service, the service must be added to the de-vice beforehand. Recently discovered devices on the network The widget allows you to view recently discovered devices on the network. It is possible to narrow down the results to a specific network map or departament selected by the Administrator:
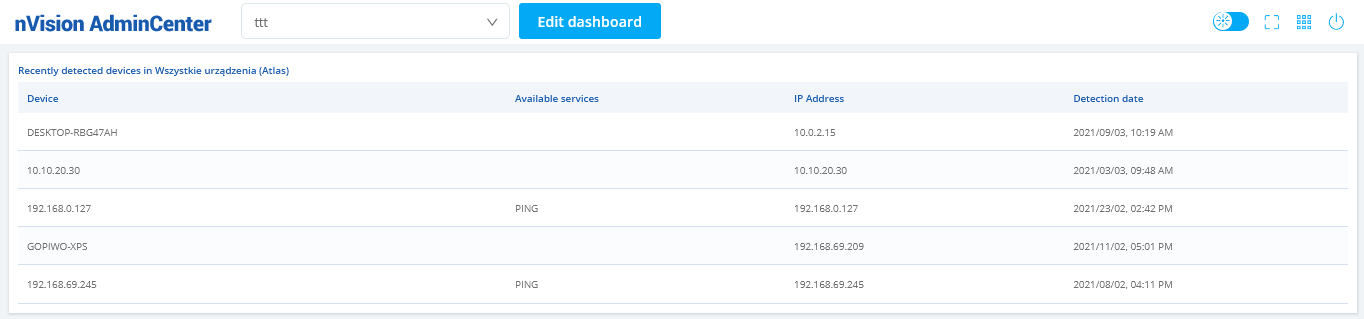
An example of a widget is shown in the screenshot below:
|