Activity on the selected day


Activity on the selected day |
|
|
The user productivity screen is divided into a few sections.
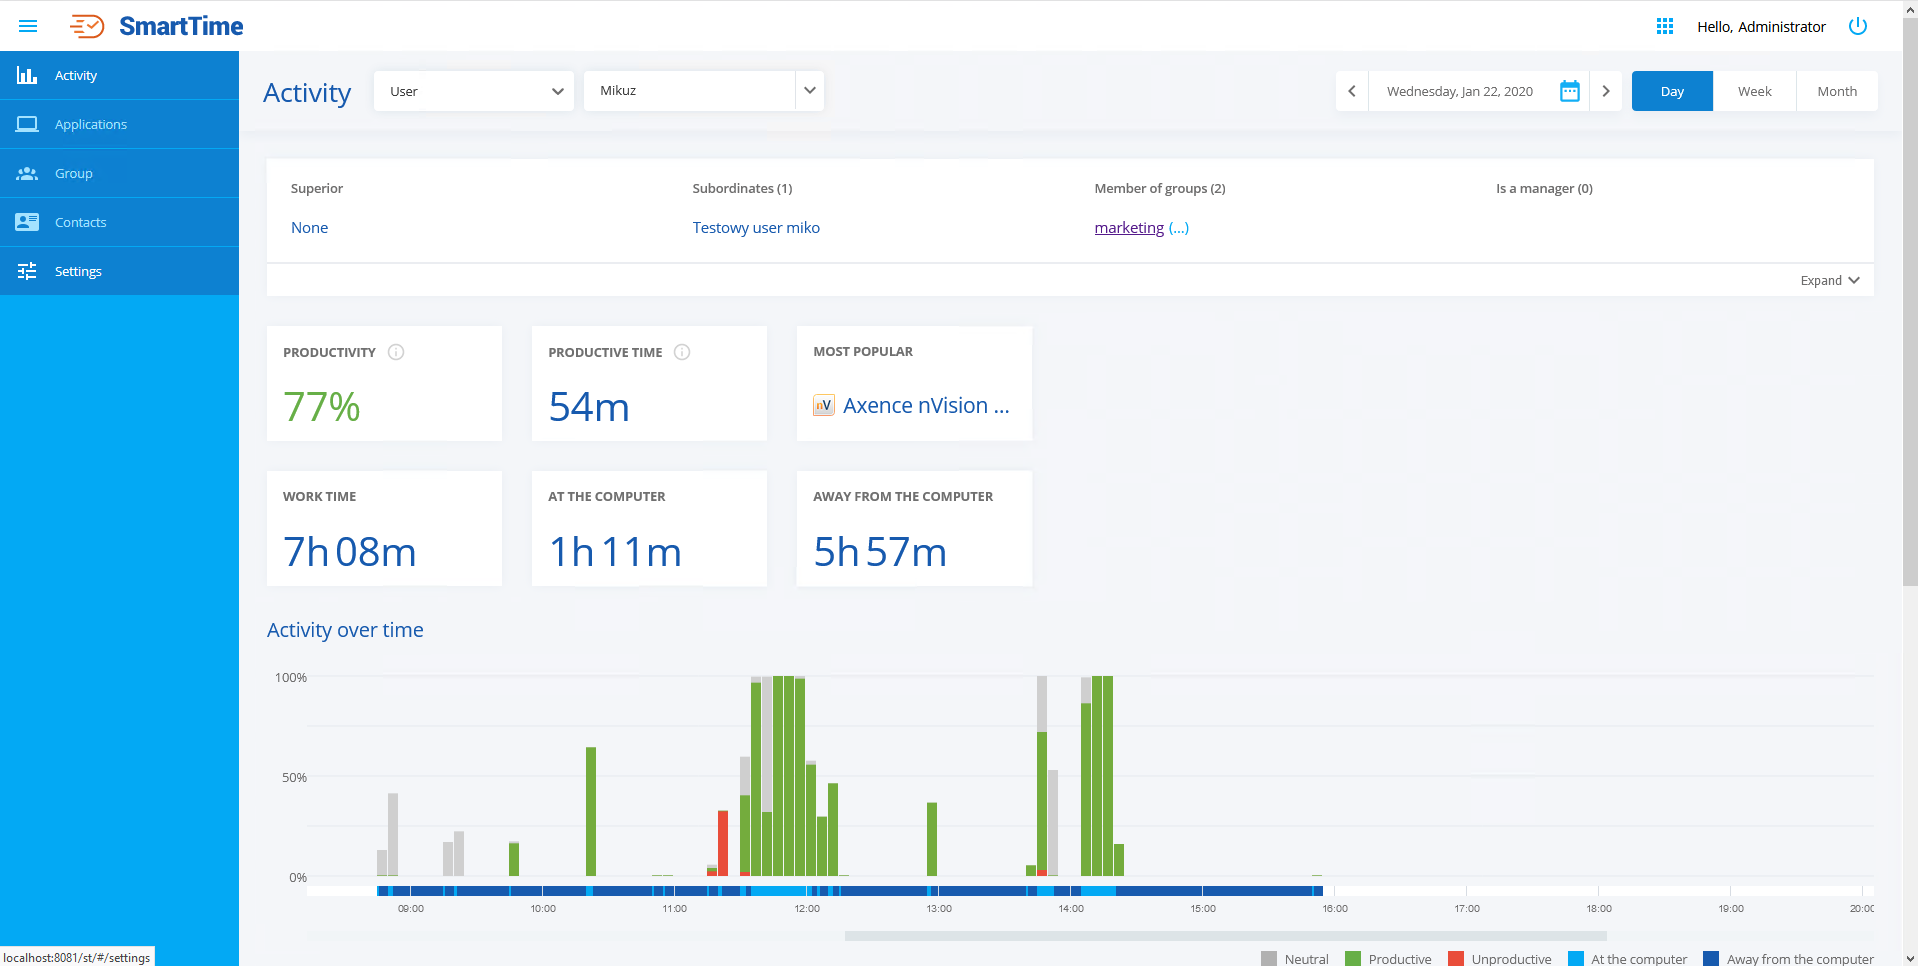
Statistics The first element of the user productivity screen is the general information about their work on the computer: •Productivity – the productivity is measured in the selected period. This is the productive time in this period divided by the duration of the user’s entire activity on the computer in this period. •Productive time – shows the amount of time spent by the user in applications classified as productive. •Most popular – displays the name of the most popular application used by the user in the selected period. •Working time – the system calculates the working time for each employee as the difference between the time of the first and last activity on each day. •On the computer – this is the time during which the system detected user activity. •Away from the computer – this is the time during which the system did not detect user activity.
Screenshot The screenshot makes it possible to view the user’s screen snapshot. This allows the superior of this employee to get approximate information about what the user is doing at that moment. It is not possible to zoom in or see the screenshot in more detail. The aim is to provide a certain privacy for the user.
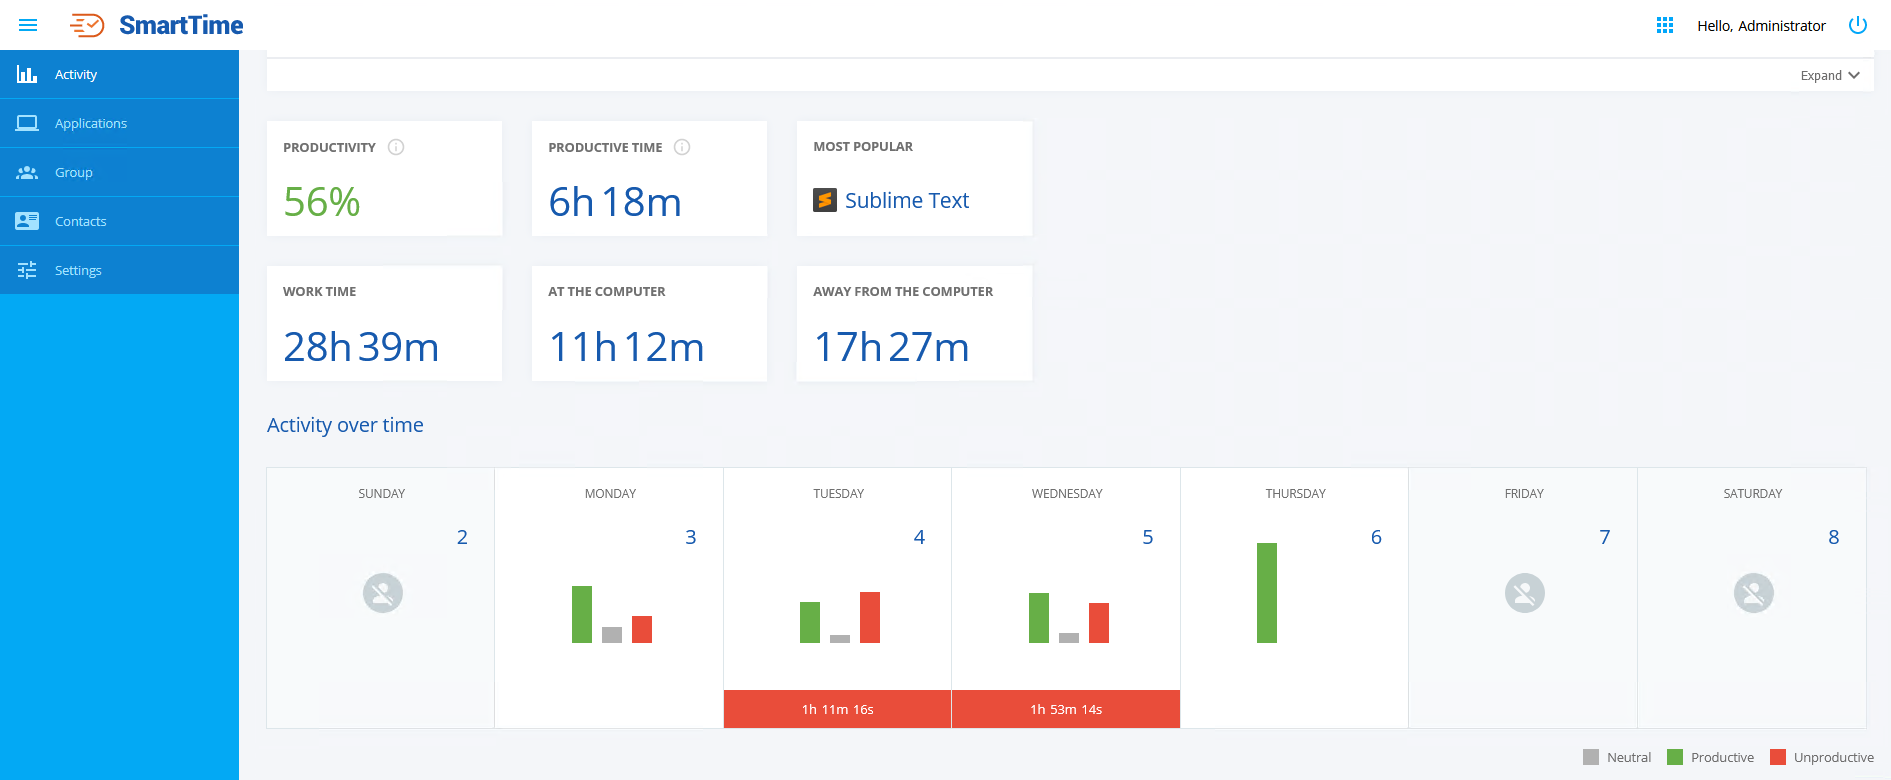
Activity over Time The next area of the productivity screen is Activity over Time. This area looks different depending on the selected time period (day, week, month, period). The daily data are presented on a timeline. Information on used applications is presented as bars representing 5-minute intervals. The chart is described in detail in chapter Activity over Time chart.
The screenshot below shows the view of activities within a single day:
When the user exceeds the time spent in unproductive applications as defined in the configuration section on a given day, that day will be highlighted. The time displayed on a highlighted background is the user’s inactivity time on that date:
Time spent in applications This part shows the time spent in applications by the user. This area of the SmartTime module is divided into three sections: productive, neutral and unproductive applications. The available information is shown as a list. The applications marked with an asterisk indicate that an exception has been applied to the application.
The Show exceptions option displays the applications for which the user group exceptions have been set. For more information about exceptions, refer to chapter Applications.
The category charts show the usage of the applications belonging to the individual categories. Information about the most and least common category applications can be found here.
|