|
NetWatch is a sophisticated tool to monitor the availability of your hosts. It continuously sends ICMP (ping) packets to all hosts on the list and allows you to check response times and the number of lost packets. This tool provides a history of these values for reporting host status over time. NetWatch allows you to set several notifications in case of a host not responding or problems with a connection. Please refer to the Alerts section for more information.
To start monitoring a host
| 1. | Select the  NetWatch tool on the navigation bar. NetWatch tool on the navigation bar. |
| 2. | Enter the host DNS name or IP address in the . |
| 3. | Select type of monitoring: TCP Port, PING or other Service. |
| 4. | Click the Add button or press Enter. |
Information provided
The main table presents basic information for each device: DNS name and IP address, geographic location of a remote IP address (helping to detect suspicious connections established by malware), response times (min/max/average), and the number of packets sent and lost.
On the main chart, you can see response times and % of packets lost for selected time. If you would like to see the exact values of response time in milliseconds, take a look at the grid placed in the sidebar. This grid stores response times for the last 5 minutes.
Main chart
On the main chart, you can see response times and % of packets lost for a selected time. Response time is presented as a line chart and % of packets lost is presented as a gradient area chart.
There is a toolbar located over the chart that lets you change chart type and time period:

Changing chart time period
You can see historical data in several time periods (e.g. the last 5 minutes, 1 hour, 1 day, 1 week and 1 month). To select the appropriate period, just select the corresponding icon on the chart toolbar.
To scroll the chart backward and forward, use the arrow icons located on the chart toolbar.
Options
The user can select whether the device will be identified with IP address or DNS name. It is especially useful for services based on a variable IP address.
You may change monitoring frequency and timeout value for selected hosts. Just select a host or several hosts and enter the desired values in the Options section on the .
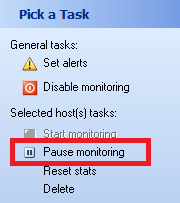
 To pause the monitoring of selected host(s) To pause the monitoring of selected host(s)
| 1. | Select a host or several hosts on the grid. |
| 2. | Select Pause monitoring option located in the Pick a task section on the . |
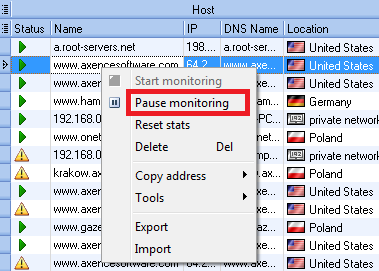
To stop the device monitoring, you can also right click the given device and select Pause monitoring in the pop-up menu.
|
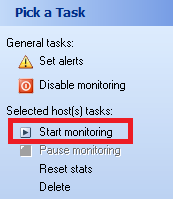
To resume monitoring selected host(s)
| 1. | Select a host or several hosts on the grid. |
| 2. | Select Start monitoring option located in the Pick a task section on the . |
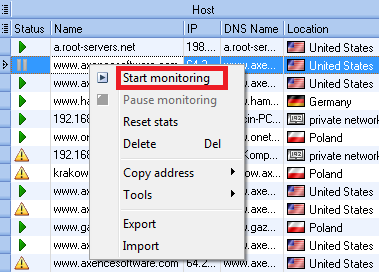
To run the device monitoring, you can also right click the device and select Start monitoring in the pop-up menu.
|
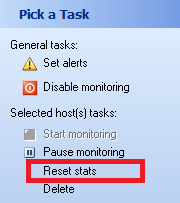
To reset statistics
| 1. | Select a host or several hosts on the grid. |
| 2. | Select Reset stats option located in the Pick a task section on the . |
| 3. | The program will ask if you would also like to remove stored statistical data for selected hosts (response time and % of packets lost). If you no longer need them select Yes in the message box. If you want to retain them answer No. |
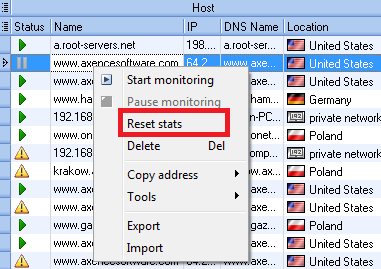
To reset the device stats, you can also right click the device and select Reset stats in the pop-up menu.
|
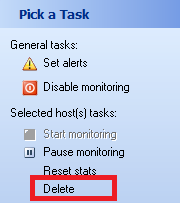
To remove a host or hosts
| 1. | Select a host or several hosts on the grid. |
| 2. | Select Delete option located in the Pick a task section on the . |
| 3. | The program will ask if you would like also to remove stored statistical data for selected hosts (response time and % of packets lost). If you no longer need them select Yes in the message box. If you would like to retain them answer No. If you keep stored data, then they will be available when you add the same host again. |
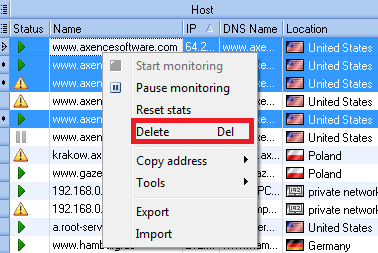
To remove the devices, you can also right click the device and select Delete in the pop-up menu or press Del button.
|
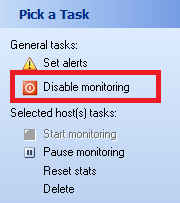
To disable/enable monitoring of all hosts
You can turn monitoring off completely by selecting  Disable monitoring option located in the Pick a Task section on the . This does not change the status of any host (active/paused). Disable monitoring option located in the Pick a Task section on the . This does not change the status of any host (active/paused).  Enable monitoring command turns monitoring back on after it has been suspended. Enable monitoring command turns monitoring back on after it has been suspended.
|
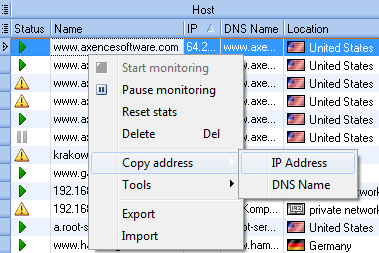
To copy a DNS name or IP address to clipboard
You can copy a DNS name or IP of the selected host to clipboard. Just right click a host in the grid and select Copy address | IP Address or Copy address | DNS Name from the context menu.
|
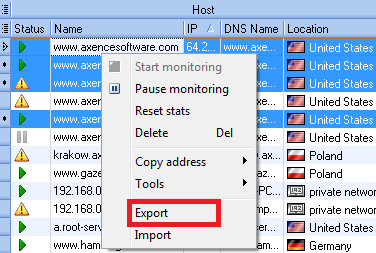
Data export
To export the table with device data, select Export in the context menu. Then choose one of the formats: html, xml, txt, xls, json (netTools file). If you want to export only the address list, select Address list (*.txt).
|
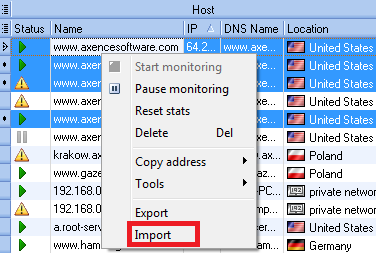
Data import
NetWatch can import two types of data: a text file with a list of addresses and monitored services and netTools file in format json. To import the table with device data, select Import in the context menu.
|
Tools
The following tools can be used from the pop-up menu:
For more information, see the chapters about specific features.
|
| 

